The Location of MH370 - A Reverse Drift Study Based On Debris Found
Click here to see map.
Introduction
The following is a reverse drift study performed on all debris pieces found thus far in Africa which either are confirmed or believed to be from MH370. The objective of this study is to try to define the most common general area with the highest probability of being the point of origin of where all these debris pieces may have originated from in the Indian Ocean. This study ignores all other data and only uses the drift data from the drift tool (www.adrift.org.au) to determine all possible origin points of all the debris pieces based on their respective locations and estimated drift times at Sea.
The objective of this study is not to determine the precise location of where MH370 wreckage is but to define the general area of where our haystack is and where we should be looking for this plane. Reverse drift science is not a precise science and many factors such as winds, currents, time of year, and drift times affect how these debris pieces may have drifted in the Oceans. However reverse drift models have been proven accurate for telling us the most probable general areas of where debris in the Oceans originated from over time.
About Adrift.org.au.
Adrift.org.au is a free quick, easy tool to quantitatively study planktonic surface drift in the Global Oceans. The tool was created and is maintained by the University of New South Wales (UNSW) in Sydney, Australia under the direction of Oceanographers Eric van Sebille and Matthew H England. The technique used to track plastic around the ocean is based on the trajectories of surface drifters from the Global Drifter Program. The trajectory information is used to form a transit matrix, which captures the statistics of drifter dispersion. In total, more than 24 million locations from 17,494 individual surface trajectories and spanning a period between 1979 to 2013 are used on adrift.org.au.
The data from each drift model can be downloaded from the website and loaded into an Excel spreadsheet. In this study I use the data generated from the web tool to create transit matrices for each reverse drift model.
How the study works.
Each piece of debris has a fixed known location and a discovery date. By using the geographical coordinates of each debris piece and estimating the drift time of each piece based on its discovery date we can create a reverse drift model for each individual piece. The drift times are determined in even number of months because the adrift web tool works in increments of 2 months only. So if an object was discovered say 25 months after March, 8th, 2014 ( date of MH370 disappearance) then the drift time would be rounded off to the nearest even month prior to discovery (i.e. 24 months). Since we have no way of knowing the exact drift times of these objects this is the best we can do for estimating these drift times at Sea. I realize that this uncertainty in drift times may introduce some errors to some models but I do not think it will drastically affect the overall results of this study because it is very likely most of these pieces were discovered within 2 months after they washed ashore in most cases.
In each reverse drift model each possible origin point is assigned a weight by the adrift software between 0 and 1, with 1 being the highest probability. To visualize this in the models I use a bubble chart to show all possible origin points and their locations on the chart. The larger the bubble size is the higher probability it has. Once all reverse drift models have been created for each debris piece the data from all models are then loaded into one composite reverse drift model which will shows us all the possible origin points for all debris pieces and which areas are common to all models and have the highest concentration of high probability origin points. This area will be the area that most likely is the origin of all the debris found and where the wreckage of MH370 most likely is.
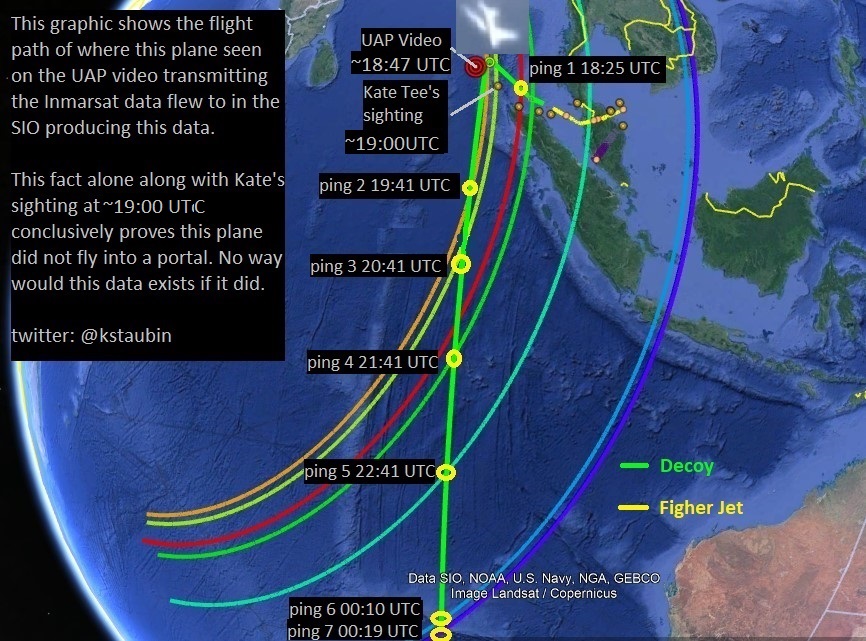
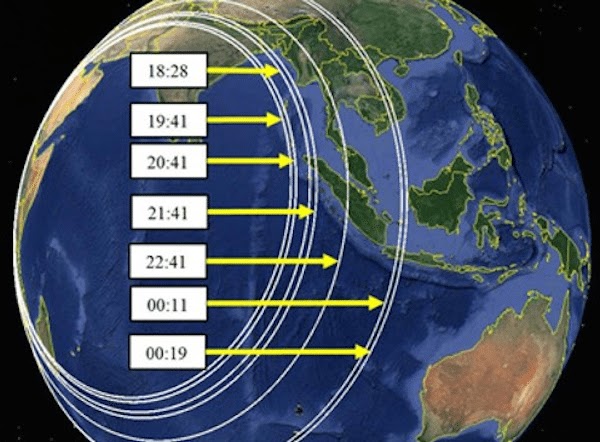
The advantage of using reverse drift modelling as opposed to forward drift modelling is that we do not have to predict a starting point of origin for each model. All forward drift models need to predict a starting point of where they suspect the plane may have crashed, usually somewhere along the 7th arc. These studies have an inherent bias and assume that the Inmarsat data is valid. In this reverse drift study we let the software try to determine as accurately as possible where this point of origin is without making any assumptions as to where this location of the plane is, therefore this reverse study in my opinion is far more objective and unbiased.
List of debris items found with their reverse drift models.
Below is a list of all debris items found thus far which are either confirmed or believed to be from MH370. Each item contains a link to their reverse drift model which can be clicked on to animate the model and show where the debris item may have originated from over time. Also included in each item is a graphic of the reverse drift model showing all origin points of each item at the specified drift time. The larger bubbles in these graphics show the locations which have highest probability.
Debris images and information courtesy of WLP twitter @Bookofresearch.
ITEM 1; Drift Time 16 months
http://www.adrift.org.au/backward?lat=-20.9&lng=55.7¢er=79.2&startmon=Jan
Reverse drift model showing all possible origin points of this item 16 months earlier.
ITEM 2: Drift Time 20 months
http://www.adrift.org.au/backward?lat=-25.06&lng=33.69¢er=79.2&startmon=Jan
Reverse drift model showing all possible origin points of this item 20 months earlier.
ITEM 3: Drift Time 22 months
http://www.adrift.org.au/backward?lat=-22.06&lng=35.52¢er=79.2&startmon=Jan
Reverse drift model showing all possible origin points of this item 22 months earlier.
ITEM 4: Drift Time 20 months
UPDATE (28-08-2016): This item was photographed in December 2015 on the beach in Mossel Bay. The item had barnacles on it which indicates the picture must have been taken shortly after it washed ashore. Because of this information this item could only have drifted at Sea not more than 21 months. The reverse drift model below was done for a 20 month drift time period. I have updated the reverse drift model for this item as well as the results section on this blog.
Here is a link to the news report which shows this photograph: http://masterherald.com/flight-mh370-engine-cowling-found-near-mossel-bay-in-south-africa-was-covered-in-barnacles-and-could-not-have-been-planted-new-photo-suggests/40252/
http://www.adrift.org.au/backward?lat=-34.50&lng=22.15¢er=79.2&startmon=Jan
Reverse drift model showing all possible origin points of this item 20 months earlier.
ITEM 5: Drift Time 24 months
http://www.adrift.org.au/backward?lat=-19.74&lng=63.47¢er=79.2&startmon=Jan
Reverse drift model showing all possible origin points of this item 24 months earlier.
ITEM 6: Drift Time 24 months
http://www.adrift.org.au/backward?lat=-25.06&lng=33.92¢er=79.2&startmon=Jan
Reverse drift model showing all possible origin points of this item 24 months earlier.
ITEM 7: Drift Time 24 months
http://www.adrift.org.au/backward?lat=-26.39&lng=32.93¢er=79.2&startmon=Jan
Reverse drift model showing all possible origin points of this item 24 months earlier.
ITEM 8: Drift Time 26 months
http://www.adrift.org.au/backward?lat=-20.02&lng=57.7¢er=79.2&startmon=Jan
Reverse drift model showing all possible origin points of this item 26 months earlier.
ITEM 9: Drift Time 26 months
http://www.adrift.org.au/backward?lat=-25.86&lng=32.75¢er=79.2&startmon=Jan
Reverse drift model showing all possible origin points of this item 26 months earlier.
ITEM 10: Drift Time 26 months
http://www.adrift.org.au/backward?lat=-20.52&lng=57.54¢er=79.2&startmon=Jan
Reverse drift model showing all possible origin points of this item 26 months earlier.
ITEM 11: Drift Time 26 months
http://www.adrift.org.au/backward?lat=-16.75&lng=50.0¢er=79.2&startmon=Jan
Reverse drift model showing all possible origin points of this item 26 months earlier.
ITEM 12: Drift Time 26 months
http://www.adrift.org.au/backward?lat=-16.75&lng=50.0¢er=79.2&startmon=Jan
Reverse drift model showing all possible origin points of this item 26 months earlier.
ITEM 13: Drift Time 26 months
http://www.adrift.org.au/backward?lat=-16.80&lng=49.98¢er=79.2&startmon=Jan
Reverse drift model showing all possible origin points of this item 26 months earlier.
ITEM 14: Drift Time 26 months
http://www.adrift.org.au/backward?lat=-16.79&lng=49.98¢er=79.2&startmon=Jan
Reverse drift model showing all possible origin points of this item 26 months earlier.
ITEM 15: Drift Time 26 months
http://www.adrift.org.au/backward?lat=-16.84&lng=49.96¢er=79.2&startmon=Jan
Reverse drift model showing all possible origin points of this item 26 months earlier.
ITEM 16: Drift Time 26 months
http://www.adrift.org.au/backward?lat=-16.84&lng=49.78¢er=79.2&startmon=Jan
Reverse drift model showing all possible origin points of this item 26 months earlier.
ITEM 17: Drift Time 26 months
http://www.adrift.org.au/backward?lat=-16.85&lng=49.81¢er=79.2&startmon=Jan
Reverse drift model showing all possible origin points of this item 26 months earlier.
ITEM 18: Drift Time 26 months
http://www.adrift.org.au/backward?lat=-16.85&lng=49.81¢er=79.2&startmon=Jan
Reverse drift model showing all possible origin points of this item 26 months earlier.
ITEM 19: Drift Time 26 months
http://www.adrift.org.au/backward?lat=-5.10&lng=39.84¢er=79.2&startmon=Jan
Reverse drift model showing all possible origin points of this item 26 months earlier.
ITEM 20: Drift Time 26 months
http://www.adrift.org.au/backward?lat=-26.89&lng=32.88¢er=79.2&startmon=Jan
Reverse drift model showing all possible origin points of this item 26 months earlier.
ITEM 21: Drift Time 28 months
http://www.adrift.org.au/backward?lat=-27.24&lng=32.79¢er=79.2&startmon=Jan
Reverse drift model showing all possible origin points of this item 28 months earlier.
ITEM 22: Drift Time 28 months
http://www.adrift.org.au/backward?lat=-29.72&lng=31.09¢er=79.2&startmon=Jan
Reverse drift model showing all possible origin points of this item 28 months earlier.
ITEM 23: Drift Time 28 months
http://www.adrift.org.au/backward?lat=-23.924&lng=35.53¢er=79.2&startmon=Jan
Reverse drift model showing all possible origin points of this item 28 months earlier.
ITEM 24: Drift Time 28 months
http://www.adrift.org.au/backward?lat=-23.76&lng=35.43¢er=79.2&startmon=Jan
Reverse drift model showing all possible origin points of this item 28 months earlier.
ITEM 25: Drift Time 24 months
http://www.adrift.org.au/backward?lat=-25&lng=47¢er=79.2&startmon=Jan
Reverse drift model showing all possible origin points of this item 24 months earlier.
ITEM 26: Drift Time 24 months
http://www.adrift.org.au/backward?lat=-25&lng=47¢er=79.2&startmon=Jan
Reverse drift model showing all possible origin points of this item 24 months earlier.
Results of reverse drift analysis.
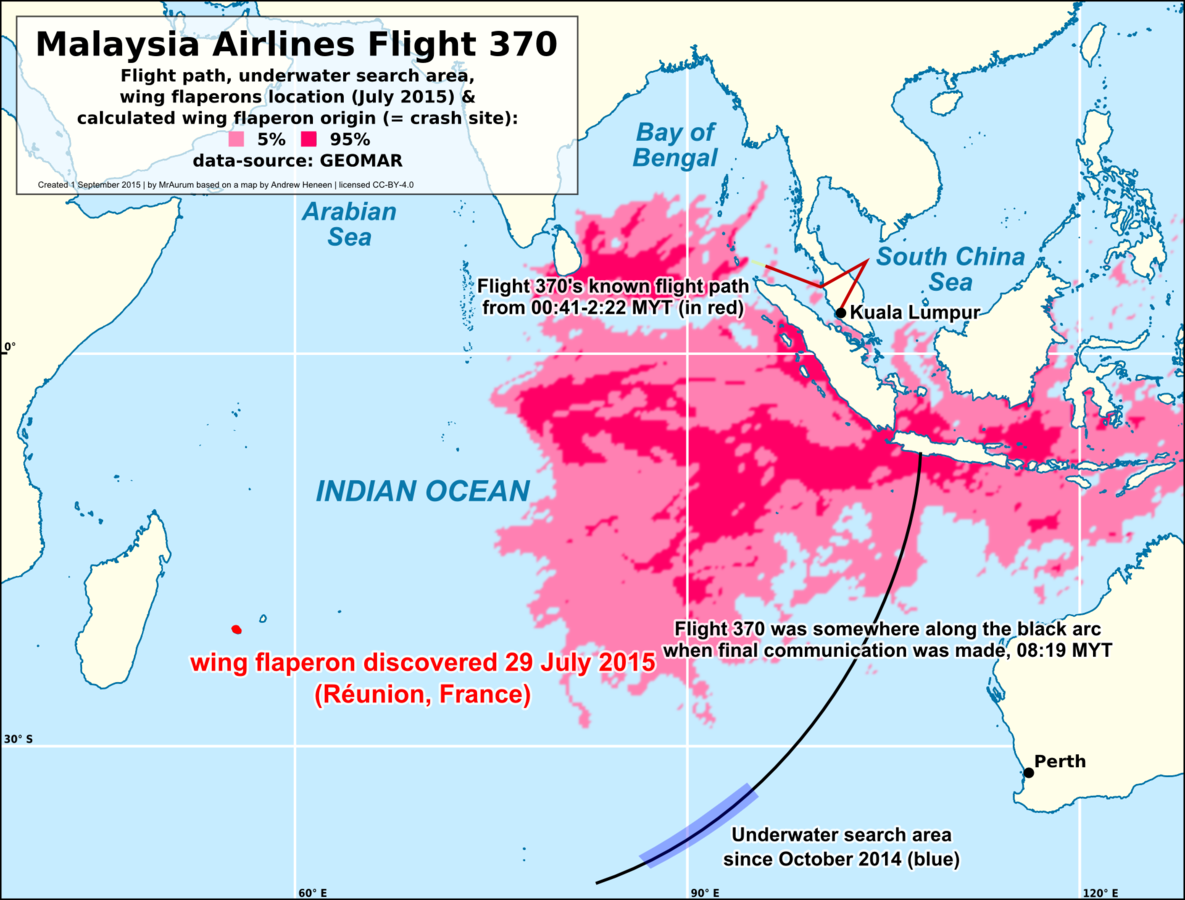
The most probable place on Earth where MH370 wreckage most likely is, in this red zone.
This excerpt from Jeff Wise's blog shows that French officials in this leaked French Judiciary Report reached a similar conclusion as to the origin of the flaperon piece and MH370's wreckage. - French Judiciary Report Raises Fresh Doubts About MH370 Debris
Click on image below to see report:
Where is MH370? - GEOMAR https://www.geomar.de/en/news/article/wo-ist-mh370/
What is particularly interesting about this area is that it includes the location of where possible aircraft debris was captured by satellite. The yellow dot in the graphic above, inside the red box, indicates the location of where this debris was spotted. The image below is the satellite image that captured this debris by a DigitalGlobe satellite on March 16th, 2014 which shows 5 pieces of debris that look very similar and match in size, shape, and appearance to parts of a B777-200ER aircraft.
Here is a link to the original satellite image posted on Tomnod. Just click on the 'X" in the intro message to see image. If you zoom out you will see that there were 100s, if not 1000s, of small debris pieces in this area: http://www.tomnod.com/campaign/mh370_indian_ocean/map/163x4rye
For more info and images on this sighting please visit this blog.
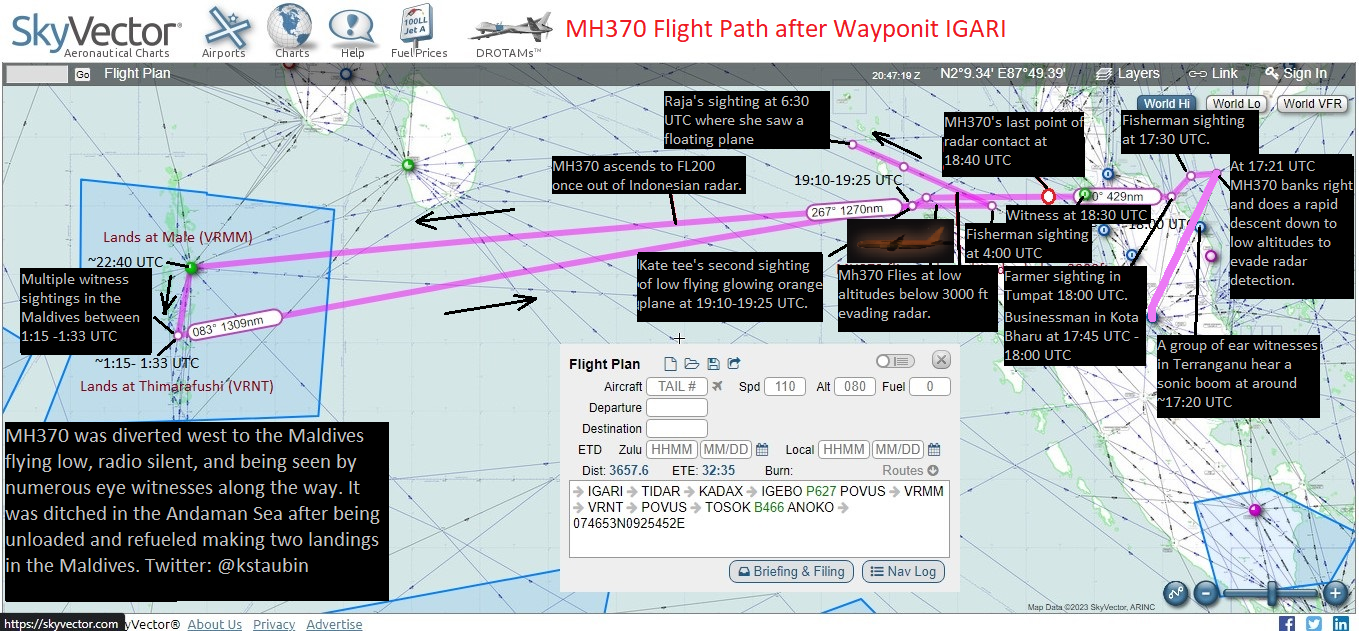
What is also interesting about this area is that there was an eye witness named Mrs. Raja Latife Dalelah who was onboard a flight from Jedda in Saudi Arabia to Kuala Lumpur on March 8th, 2014. She reported seeing an aircraft like object floating in the Andaman Sea at 2:30 PM MYT ( 6:30 UTC). The graphic below shows where her sighting occurred which is directly North of where debris in the satellite photo was captured on March 16th, 2014. Ocean currents in this part of the Andaman Sea tend to flow from North to South so it is very possible she may have seen this debris 8 days earlier on the 8th of March just after the plane crashed there.
Here is a link to a blog on Raja's report.
My belief is that the plane broke apart into several large pieces with hundreds, if not thousands of smaller pieces floating on the surface and drifted towards the South. I believe that after the debris was captured by satellite on the 16th the debris field continued to drift South for several more days eventually with the large pieces becoming water logged and sinking near the Equator and the rest of the smaller surface debris ( flotsam ) drifting towards Africa.
Forward Drift Model
Below is a forward drift model whose origin point is close to where this debris was spotted and shows how debris from this location could have drifted towards Africa. This forward drift model also explains why no debris has shown up on the shores of Australia. Here is a forward drift model from adrift.org.au starting at Lat 4.5N Long 90.7E in the month of March.
http://www.adrift.org.au/map?lat=4.5&lng=90.7¢er=96.2&startmon=Mar
Forward Drift Model: Click on image to animate. The Model shows why debris in southeast Africa only started showing between 16- 24 months and why no MH370 debris has been found in Australia.
Flaperon Barnacle Data: Click on image to animate
In a study by scientist Patrick De Deckker of the Lepas anatifera barnacles found on the Flaperon piece which washed ashore on Reunion Island the study concludes the following;
"The start of the growth was around 24 degrees (Celsius) and then for quite some time, it ranged between 20 and 18 degrees (Celsius). And then it went up again to around 25 degrees."
Based on this forward drift model (see above) and this animated GIF of Sea Surface Temperatures we can see how the flaperon may have drifted from warmer waters (>24C) near Sumatra into cooler waters (18-20 C) between 10S and 30S and then into warmer waters (25 C) near Reunion Island. This forward drift model seems to be consistent with De Deckker's findings.
Here is a link to a another barnacle study done by the University of South Florida and here are their findings on these barnacles attached to the flaperon piece.
Click on image below to animate and see Sea Surfaces Temperatures (SST) by month
As new debris pieces in the future are discovered I will be periodically updating this model. As time goes by the drift models become increasingly more complex and more dispersed therefore these reverse drift models over longer periods of drift time tend to become less accurate. Having said that I do not expect that these newer discoveries will have any great effect on the overall results in this study.
Conclusions and Recommendations
Based on the results in this study I highly recommend that the ATSB immediately terminate its seabed search in the Southern Indian Ocean. There is no way that all these pieces found in Africa came from anywhere near that search zone. To continue that search would only be a waste of more time and money.
I recommend to the Governments of Australia, Malaysia, and China that a new search zone be defined off the coast of Indonesia starting at these coordinates ( 4.63N, 90.72E ) where possible aircraft debris was captured in satellite imagery. I believe that this debris drifted south for several more days with the large pieces eventually becoming water logged and sinking somewhere near the Equator south of these coordinates. This is where the bulk of the wreckage should be found and the debris which remained on the surface ( flotsam ) drifted from this area and eventually ended up in Africa based on the analysis of this model.
It is my hope that a new search area be created in the area defined in this study based on the physical debris evidence, Ocean drift science, satellite imagery data, and eye witness reports and not based on vague, imprecise, and possibly compromised Inmarsat data. For the sake of the 239 families of the passengers onboard and the travelling public at large we must find this plane no matter what the cost. Failure in this case is not an option.
Cheers,
Ken S
Twitter @kstaubin
References and Data.
Here is my Excel spreadsheet including all data used in this study.
Erik van Sebille, Faculty of Science, University if New South Wales Sydney : report
Plastic Adrift website.
Interactive debris map.


alot of work there dude fair play.
ReplyDelete